- Awareness Stats
- Engagement Stats
- Which Professions Are Most Engaged?
- What Information is Most Popular?
- How Do People Find Your Products?
- Product Popularity
Within your company dashboard, we provide you with detailed analytics so you can track how your product listings are performing, and spot opportunities to make tweaks and improve.
(You can read about our approach to providing the most accurate statistics on the market here).
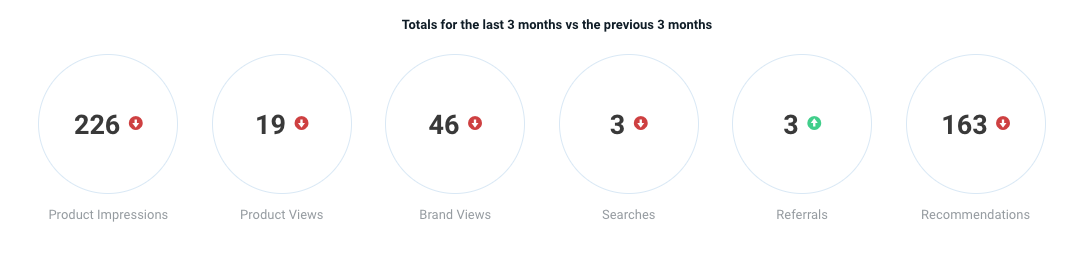
Awareness Stats
This graph provides an overview of how much awareness there is of your products on SpecifiedBy.
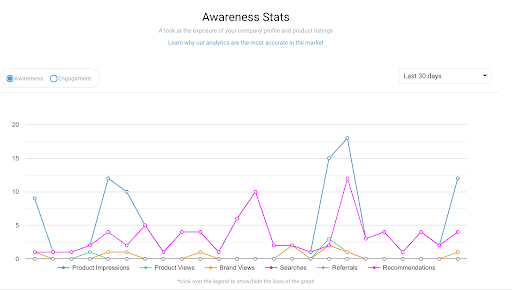
This includes:
Product Impressions - how often your product listings have been seen in search results, category pages etc.
Product Views - how many times specifiers have clicked through to view your individual product pages
Brand Views - how many times specifiers have viewed your company profile and brand
Searches - how many times there have been searches which your products match
Referrals - how many times specifiers have clicked through to visit your website (note - our goal is to convert users into leads for you, rather than send anonymous traffic to your website)
Recommendations - how many times your products have appeared as 'Recommended' products on SpecifiedBy
You can change this graph to show you either the last 7 days, 30 days, 3 months or 6 months.
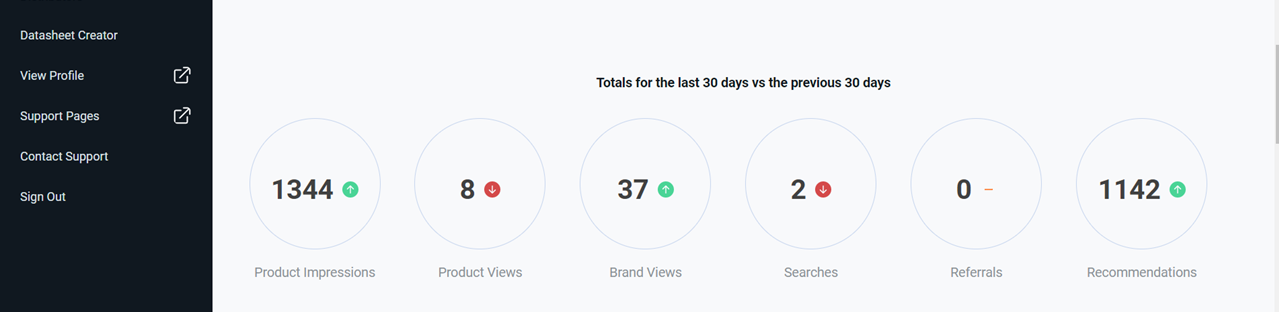
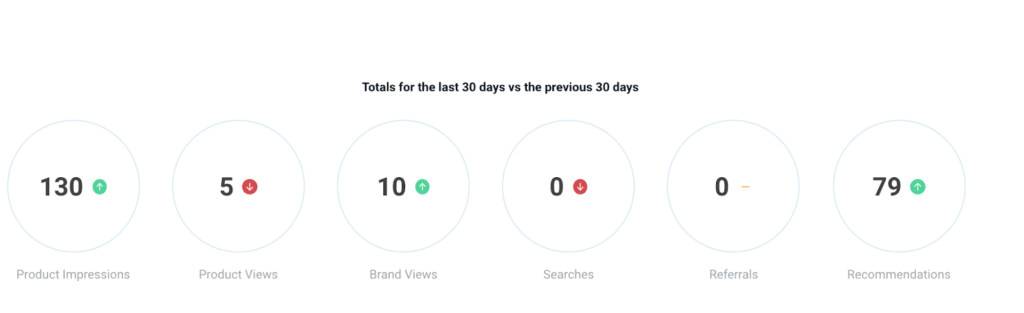
The totals listed below the graph also show whether performance is up or down, compared to the equivalent previous time period.
Engagement Stats
By switching the Awareness graph over to Engagement, you can view more detailed statistics.

The Engagement graph provides an overview of specific actions specifiers have taken in relation to your product listings.
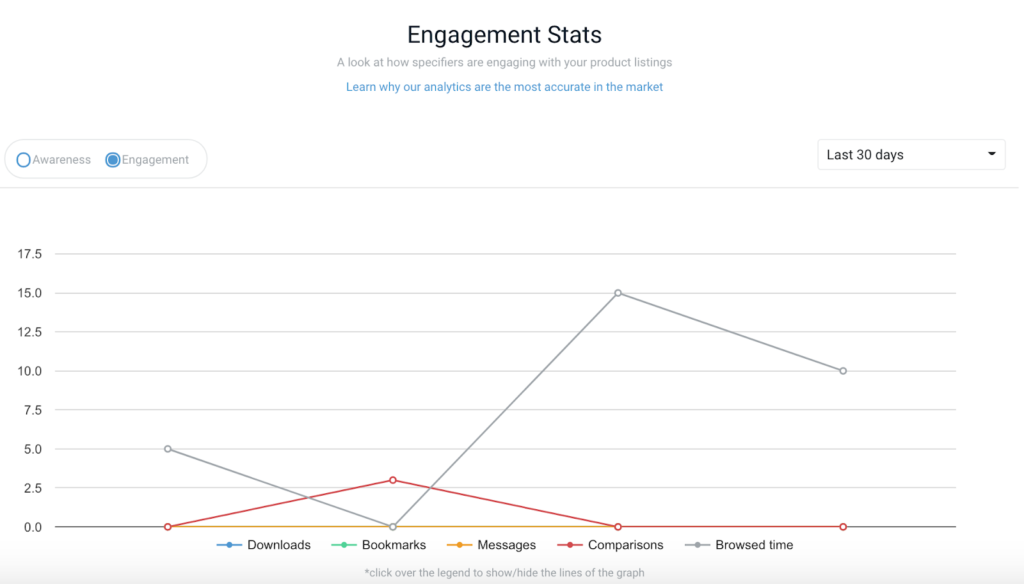
This includes:
Downloads - the number of times your files have been downloaded by specifiers
Saves - the number of times specifiers have saved your products to a project or folder on SpecifiedBy
Messages - the number of messages, enquiries and quote requests you have received from specifiers
Comparisons - the number of times specifiers have added your products to a comparison
Browsed Time - the total amount of time specifiers have spent viewing and engaging with your products
Which Professions Are Most Engaged?
In this section of the analytics dashboard, we show you a breakdown of which professions are interested in your products, such as Architects versus Surveyors.

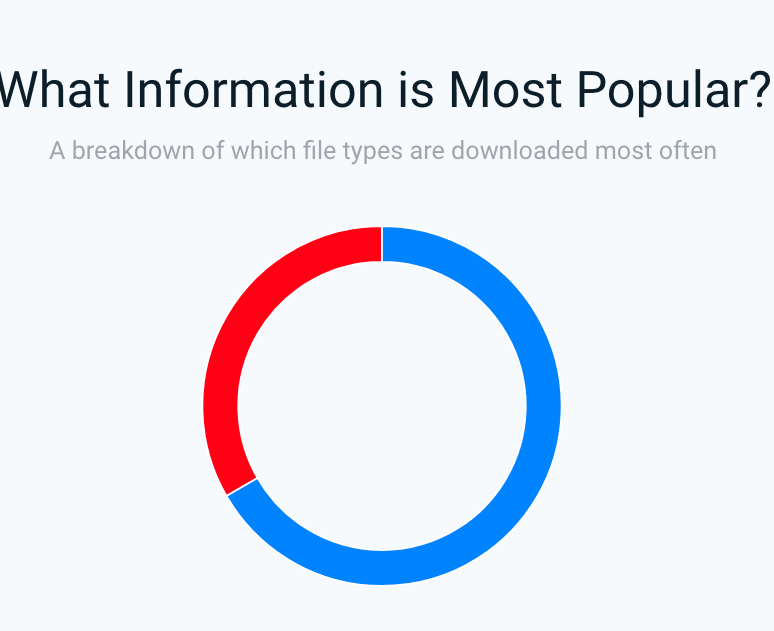
What Information is Most Popular?
In this section of the analytics dashboard, we show you a breakdown of which file types are generating the most interest. For example, are specifiers more interested in CAD details versus Case Study documents or brochures.
How Do People Find Your Products?
A summary of how specifiers end up viewing your products on SpecifiedBy.
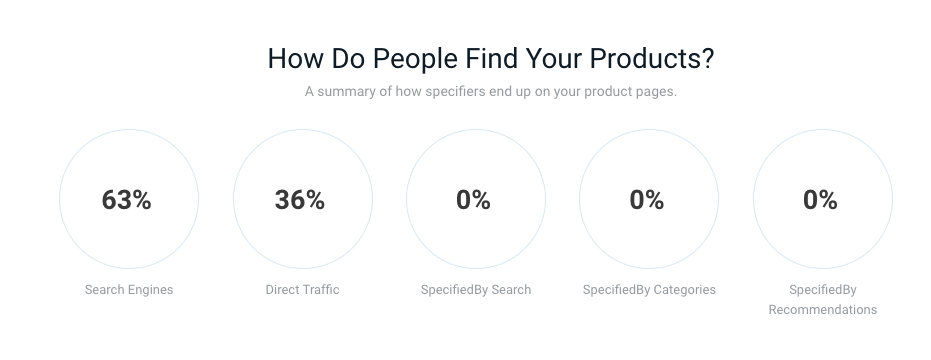
Search engines - product views which have come directly as the result of Google searches
Direct traffic - product views which are a result of someone coming direct to the product page (usually an indication that the page has been bookmarked)
SpecifiedBy Search - product views which result directly from searches on SpecifiedBy
SpecifiedBy Categories - product views which result from someone browsing through product categories on SpecifiedBy
SpecifiedBy Recommendations - product views which result from your products being shown as 'Recommended' products.
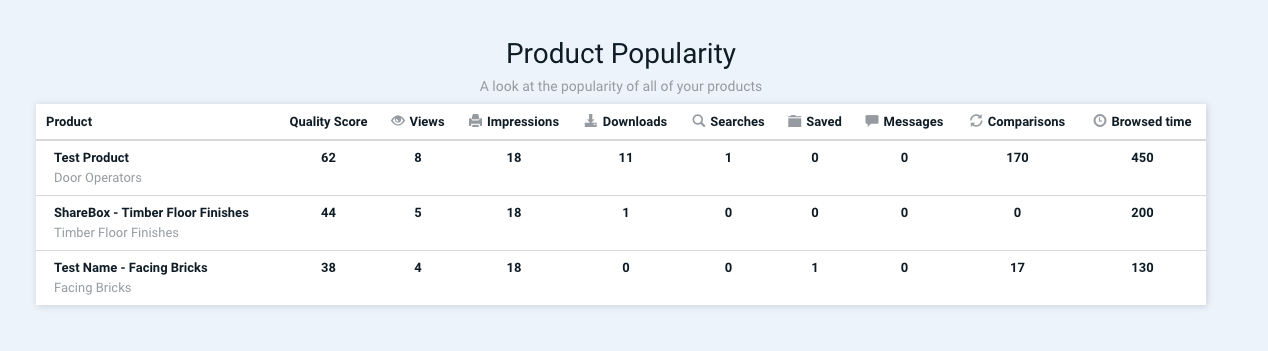
Product Popularity
A table showing the popularity of each product, across a range of measures including; views, impressions, file downloads, searches and comparisons.